2026 Top Solar Panel Manufacturers in USA?

Choosing the 2026 top solar panel manufacturers in the USA requires more than comparing nameplate efficiency. Factory location, cell sourcing, warranty terms, and delivery capacity can matter just as much. SEIA and Wood Mackenzie reported that the United States installed about 50 gigawatts of solar capacity in 2024, a record year. Their U.S. Solar Market Insight report also tracks rapid growth in domestic module manufacturing. These figures help explain why solar usa searches increasingly focus on where panels are made, not only how they perform. Still, a U.S. factory address does not prove every component was manufactured domestically.

This guide compares manufacturers using practical criteria: production scale, product efficiency, reliability testing, warranty coverage, and evidence of U.S. manufacturing. It distinguishes module assembly from cell and materials supply, which marketing pages can blur. The U.S. Department of Energy’s Solar Photovoltaics Supply Chain Review describes important manufacturing and supply-chain constraints. That matters. Buyers should check current product documents and project-specific availability rather than rely on old announcements. Numbers can shift. A company may announce a factory before it reaches steady commercial production. The comparisons that follow are a dated market snapshot, not a guarantee of pricing, shipment timing, or long-term performance.
2026 Top Solar Panel Manufacturers in USA?

How Solar Panel Manufacturing in the United States Is Defined

How should “solar panel manufacturer in the United States” be defined? A factory’s location matters, but so does the step performed there. A panel assembled domestically from imported cells is not the same as a panel whose cells, wafers, and silicon were also produced in the United States. The distinction is important.

SEIA and Wood Mackenzie’s Q4 2024 Solar Market Insight reported roughly 42 gigawatts of U.S. solar module manufacturing capacity by year-end. That figure describes potential annual output, not necessarily panels completed or sold. Capacity can sit idle, and module assembly alone does not show how much of the supply chain is domestic. Look for separate figures for cells, wafers, and modules.

For a useful comparison, ask what the company actually makes, where each production stage happens, and whether reported capacity is operating. Check the reporting date, too. A new plant may be announced before it produces commercial panels. Details matter. Public industry reports offer a stronger basis than a broad “American-made” label, though tracing every component can still be difficult. That gap deserves scrutiny.


Criteria for Identifying Leading U.S. Solar Panel Manufacturers in 2026

Assessing U.S. solar panel manufacturers in 2026 should start with verifiable factory capacity, not marketing claims. SEIA and Wood Mackenzie’s U.S. Solar Market Insight, Q4 2024, reported domestic module manufacturing capacity above 40 GW. That expansion matters, but nameplate capacity is not dependable output. Ask whether plants are operating, components are traceable, and published capacity matches shipments. Details matter.

Product quality needs equal scrutiny. Check third-party IEC or UL certification, factory audits, warranty terms, and independent field-performance data. NREL’s Compendium of Photovoltaic Degradation Rates reports a median degradation rate near 0.5% per year across reviewed studies; actual results vary with climate, installation, and measurement methods. A warranty alone proves little. Compare its degradation guarantees with test conditions, exclusions, and service procedures. Also review financial durability: replacement obligations can outlast a factory. Not glamorous, but important. Strong candidates disclose quality-control sampling, material changes, and delivery lead times. No scorecard is perfect. Public data can lag, and domestic assembly does not necessarily mean a fully domestic supply chain. Treat gaps as questions to investigate, not automatic disqualifiers.

2026 U.S. Solar Manufacturing Benchmark: Domestic Content Threshold

A policy-based benchmark for evaluating the relevance of U.S. solar manufacturing. The percentages show the domestic content thresholds for qualifying projects seeking the federal domestic content bonus—not company market shares or manufacturer ratings.

The threshold rises to 50% for projects beginning construction in 2026. This benchmark can help contextualize domestic supply-chain capabilities, but it does not rank individual manufacturers. Source: U.S. Treasury and IRS, Notice 2023-38.

Profiles of Major Solar Panel Manufacturers Operating in the United States

Profiles of Major Solar Panel Manufacturers Operating in the United States

The U.S. manufacturing landscape includes companies using different technologies and production models. One established producer makes thin-film modules at a large Ohio facility. Its integrated process handles several production stages on-site, which can simplify quality checks and reduce dependence on imported components. Thin-film panels also perform differently from conventional silicon modules under heat and low-light conditions. Buyers should compare tested output, warranties, and project requirements—not assume one technology suits every roof or utility site.

Several newer factories focus on crystalline-silicon modules, with production concentrated in Southern states. Their lines assemble cells into panels designed for residential, commercial, or utility-scale projects. Expansion has been rapid, but announced factory capacity does not always equal steady, verified production. That distinction matters. The SEIA and Wood Mackenzie U.S. Solar Market Insight report for the fourth quarter of 2024 put domestic module manufacturing capacity at about 42 gigawatts. Capacity is not a guarantee of locally sourced cells, glass, or other parts. For procurement teams, factory location, supply-chain disclosures, product testing, and documented output deserve close review. A label alone tells only part of the story.

Comparing Manufacturers by Technology, Production Capacity, and Products

Comparing U.S. solar panel manufacturers in 2026 takes more than checking factory size. Cell technology affects efficiency, heat performance, and long-term energy yield. TOPCon and heterojunction designs are gaining attention, while back-contact modules can suit projects with limited roof space. Some production lines still use older cell architectures. That is not automatically a drawback, but buyers should compare current product data rather than rely on broad claims.

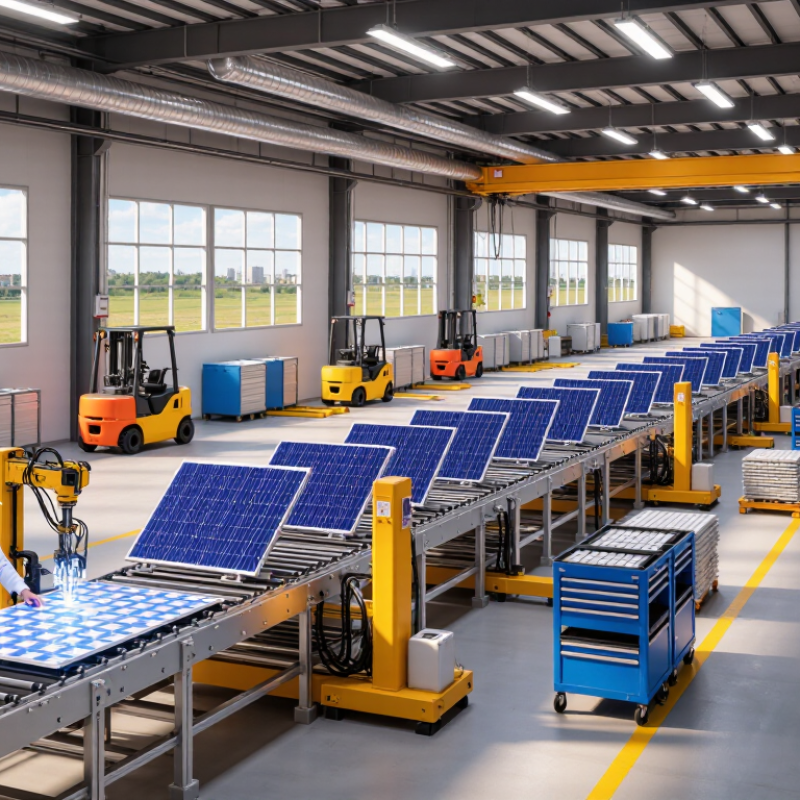
Capacity needs careful reading. A stated annual figure may describe nameplate capacity, not panels actually produced in the United States. Ask whether the number covers cells, modules, or both, and whether the facility is running consistently. A busy factory floor is encouraging. Still, output can change with equipment, staffing, and supply availability. Public disclosures and independent product testing offer useful checks, though figures may not be directly comparable.

Product range matters too. Manufacturers may offer residential modules, larger utility-scale panels, or products designed for specific mounting conditions. Compare rated power, dimensions, temperature coefficients, warranty terms, and degradation data on the same basis. Look closely at the datasheet. A higher wattage panel may simply be larger, not more efficient. I would also treat any single ranking with caution; a neat list can hide gaps in public information and differences between factory capacity and delivered product.

How to Evaluate U.S.-Made Solar Panels for Different Applications

For a rooftop home, the best U.S.-made panel is not automatically the one with the highest rated output. Compare its dimensions, weight, and electrical characteristics with the roof’s usable area, inverter, and expected shade. A narrow roof with vents may benefit more from flexible layout options than a small efficiency gain. That detail matters.

Check what “U.S.-made” means for the specific product. Ask for written information on where the cells and modules are manufactured, and review the datasheet, independent safety certifications, and warranty terms. Manufacturing steps and component origins can differ. Do not rely on a label alone. A clear paper trail makes comparisons more reliable, though it cannot answer every sourcing question.

For commercial roofs, examine wind and snow-load ratings, mounting requirements, and the cost of replacing a panel later. For off-grid systems, check low-light performance, temperature behavior, and compatibility with batteries and charge equipment. Compare warranted output over time, not just day-one power. Also confirm that local installers can handle the chosen format and provide service. A polished specification sheet can still leave practical gaps. One question is easy to miss: how quickly can a matching replacement arrive if a panel fails?

2026 Top Solar Panel Manufacturers in USA? - How to Evaluate U.S.-Made Solar Panels for Different Applications

Application-based comparison: The figures below are indicative ranges for commercially available crystalline-silicon modules, not specifications for a particular manufacturer or a ranking of manufacturers. Actual specifications vary by model.

Application Typical module power Typical module efficiency Typical power temperature coefficient Common warranty profile What to prioritize
Residential rooftops About 400–460 W About 20–23% About −0.24 to −0.35%/°C Product warranty commonly 15–25 years; performance warranty commonly 25–30 years Roof-area efficiency, module dimensions and weight, shade behavior, installer compatibility, and product-warranty terms.
Commercial and industrial rooftops About 450–600 W About 20–23% About −0.24 to −0.35%/°C Product warranty commonly 15–25 years; performance warranty commonly 25–30 years Roof loading and wind requirements, electrical design, module format, degradation terms, and the availability of replacement modules.
Utility-scale ground-mounted systems About 550–700 W About 21–23% About −0.24 to −0.35%/°C Performance warranty commonly 25–30 years; product warranty varies by model and supplier Energy yield modeling, tracker and inverter compatibility, mechanical-load ratings, supply continuity, and project-level service support.
Hot-climate or high-temperature sites Select from the range appropriate to the system design Compare model-specific datasheets A less-negative coefficient generally means lower power loss as cell temperature rises Compare the written terms and exclusions, not warranty length alone Temperature coefficient, ventilation and mounting design, operating-temperature limits, and modeled energy production at local conditions.
Projects requiring U.S. manufacturing documentation Not a manufacturing-origin measure Not a manufacturing-origin measure Not a manufacturing-origin measure Review the named warranty provider and its service process Request written documentation identifying where the module is assembled and, when relevant, where cells and other components are made. “U.S.-made” claims can refer to different stages of production.

Before selecting a panel: Verify the exact model’s datasheet, written warranty, applicable safety certifications (such as UL 61730), mechanical-load ratings, and manufacturing-origin documentation. Compare total system energy yield and installed cost rather than wattage alone.