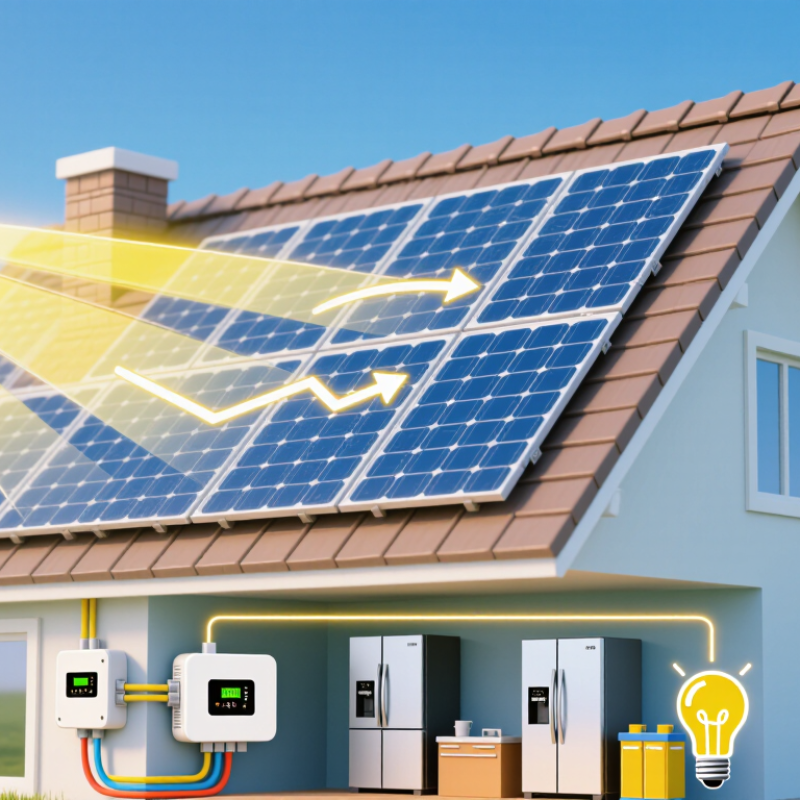
Sun energy is the light and heat that Earth receives from the Sun. It travels through space as electromagnetic radiation, carrying energy across millions of miles. A rooftop solar panel captures some of that light. Inside its photovoltaic cells, sunlight helps move electrons, creating direct-current electricity. An inverter then converts that current into alternating current for household appliances. The process is quiet. No fuel is burned at the point of generation.
Solar technology can also use sunlight as heat. Solar thermal collectors warm water or another fluid, which can supply hot water or support heating systems. In both cases, the amount of useful energy depends on several practical details: sunlight intensity, panel direction, shade, temperature, and equipment condition. Clouds matter. Output can change from hour to hour, and solar panels do not produce electricity at night. Batteries can store some daytime power, while grid connections can help balance supply, but neither removes every limitation.
Understanding how sun energy works means looking beyond the panel itself. The system includes electrical components, mounting hardware, wiring, and, sometimes, storage. A well-designed installation considers local weather and the building’s actual energy use, rather than relying on a single advertised efficiency figure. Even careful estimates can miss something; trees grow, roofs age, and household habits change. That uncertainty is worth acknowledging. Solar power can reduce reliance on other energy sources, but its real performance is best judged over time, using measured production and clear information about the system.
Sun energy is the radiant energy released by the Sun, mainly as visible light, infrared, and ultraviolet radiation. At its core, hydrogen nuclei fuse into helium under extreme heat and pressure. A small amount of mass becomes energy. That is the source. Photons travel outward, then cross the roughly 150-million-kilometre gap to Earth in about eight minutes. NASA measurements put sunlight at the top of Earth’s atmosphere near 1,361 watts per square metre. This is an average, not the amount a rooftop or field receives.
The IPCC Sixth Assessment Report describes roughly 0.1% variation in total solar irradiance across the Sun’s 11-year cycle. Local sunlight changes far more with clouds, season, latitude, and surface angle. A winter window can feel bright while delivering modest energy; a clear summer roof receives much more. Plants store sunlight through photosynthesis, while solar panels convert part of it into electricity. Neither captures everything: reflection, heat, dust, and shading reduce useful output. “Free energy” is an incomplete phrase. Sunlight is abundant, but reliable collection still depends on place, timing, and equipment.
The Sun produces energy through nuclear fusion in its core, where immense heat and pressure push hydrogen nuclei together. They form helium, and a small amount of mass becomes energy. This process releases light and other forms of radiation. It is not a fire: ordinary burning needs oxygen, while fusion happens through nuclear reactions.
That energy does not travel straight from the core to space. Photons can be absorbed and re-emitted many times inside the Sun, taking a remarkably long and uneven route outward. Near the surface, energy escapes as sunlight and heat. Sunlight takes about eight minutes and twenty seconds to reach Earth. The journey inside the Sun is harder to describe with one simple travel time; conditions vary, and estimates depend on what path is considered. A neat diagram can hide that complexity.
Tips: To picture the process, imagine sunlight warming your hand through a window. The warmth comes from radiation, not air carried from the Sun. Solar panels convert some incoming light into electricity, but clouds, shade, and panel angle affect how much they capture. A small detail, perhaps: sunlight feels immediate, though it began its outward trip long before reaching us.
Sunlight travels through space as electromagnetic radiation, crossing roughly 150 million kilometres from the Sun to Earth. The journey takes about 8 minutes and 20 seconds, according to NASA. Space is mostly empty. Radiation arrives in different wavelengths, including visible light, ultraviolet, and infrared. Earth’s atmosphere then scatters, reflects, or absorbs some of it; clouds can dim a bright afternoon in minutes.
NASA Earth Observatory’s energy-budget estimates put incoming solar energy at about 340 watts per square metre, averaged across the whole planet. Around 29% is reflected back to space, while about 23% is absorbed by the atmosphere and clouds; roughly 48% reaches and is absorbed by Earth’s surface. These are global averages, not a prediction for one rooftop or one hour. A tidy average can mislead: latitude, season, cloud cover, and the Sun’s angle change the energy arriving at a particular place.
Tips: For a practical estimate, check local solar-irradiance data and note the time, weather, and panel angle. A clear noon sky helps, but it does not tell the whole story. Measurements vary, and even good data cannot make every day predictable.
Sunlight carries energy in packets called photons. In a photovoltaic panel, photons strike semiconductor cells, often made from silicon. Their energy frees electrons, and the cell’s electric field helps guide them into a current. Light becomes direct-current electricity. Small detail, big effect.
Wires carry that current to an inverter, which changes it into alternating current for household circuits. Depending on the system, electricity may power appliances, charge a battery, or flow to the grid. Solar-thermal systems use another route: collectors capture sunlight as heat, which can warm water or drive a turbine. Same sun, different pathway. Not every roof has useful exposure.
Output varies with clouds, shade, panel angle, temperature, and dust. A thin film of grime seems harmless. Yet a narrow tree shadow can cut output more than expected. Monitoring readings across seasons gives a clearer picture than judging performance from one sunny afternoon. Solar power is quiet, but not effortless. Equipment requires materials and maintenance, while batteries add cost and complexity. Daily production charts can be reassuring, though they may make a variable energy source seem more predictable than it really is.
The amount of solar energy we can use depends on more than how brightly the Sun shines. Sunlight travels through the atmosphere, where clouds, dust, and moisture can scatter or absorb some of it. On a clear afternoon, a rooftop may receive strong direct light; on a cloudy day, it still receives weaker, diffuse light. Seasons matter too. Short winter days usually mean fewer hours for generating electricity.
At a particular site, shade from trees, chimneys, or nearby buildings can reduce a solar system’s output. The direction and tilt of its panels also affect how much sunlight they collect. Panels can become less efficient when they get very hot, despite the sunny weather. And collected energy is not always available when needed: storage, system losses, and household demand shape how much people can actually use. Local solar data and a site inspection offer a more reliable estimate than sunshine alone. Estimates still have uncertainty.
Tips: Check where shadows fall at different times of day. Keep seasonal changes in mind, and compare expected production with your energy use. A small roof detail can matter.
| Factor | How It Affects Usable Solar Energy | Useful Data or Typical Range | Practical Consideration |
|---|---|---|---|
| Sunlight intensity | Stronger sunlight delivers more energy to a solar panel and can increase its electrical output. | Standard panel testing uses an irradiance of 1,000 W/m². Actual sunlight at a site changes with weather, time, and atmospheric conditions. | Local solar-resource maps and measured site conditions give a better estimate than daylight hours alone. |
| Location and latitude | Location influences the sun’s angle, day length, and seasonal sunlight, all of which affect energy production. | Average peak sun hours vary widely by region and season; they represent equivalent hours at 1,000 W/m², not total daylight hours. | Use local, month-by-month solar data when estimating annual or seasonal production. |
| Season and day length | Longer days and a higher sun angle can provide more daily solar energy. Short winter days often reduce output. | Day length depends on latitude and season; the difference between summer and winter is greater at higher latitudes. | Account for winter production if solar energy must meet year-round needs. |
| Cloud cover and atmospheric conditions | Clouds reduce direct sunlight, although panels can still generate electricity from diffuse light. Haze, smoke, and dust in the air can also reduce incoming sunlight. | Output on overcast days can range from a small fraction to a substantial portion of clear-sky output, depending on cloud thickness and site conditions. | Do not assume that every cloudy day produces the same reduction; weather patterns vary. |
| Panel direction and tilt | Panels capture more sunlight when oriented toward the sun’s typical path and set at a suitable angle. | In the Northern Hemisphere, south-facing panels commonly receive strong annual sunlight; in the Southern Hemisphere, north-facing panels commonly do. | Nearby roofs, seasonal goals, and local conditions may make a different orientation more suitable. |
| Shading | Trees, buildings, chimneys, or other obstructions can reduce panel output. Partial shade may affect a larger portion of a system than the shaded area alone. | The effect depends on the shade’s location, duration, and the electrical design of the solar array. | Check the site throughout the day and across seasons before selecting a panel location. |
| Panel efficiency | Efficiency describes how much incoming sunlight a panel converts into electricity; higher efficiency can provide more power from a given panel area. | Many commercially available panels have module efficiencies in the approximate range of 15%–23%, with values varying by technology and product. | Efficiency is not the same as total energy production, which also depends on panel area, sunlight, and system losses. |
| Panel temperature | Solar panels generally produce less power as their cell temperature rises above the reference temperature used for testing. | Many crystalline-silicon panels have a power temperature coefficient around −0.3% to −0.5% per °C above 25°C. | Airflow behind panels can help limit operating temperatures; hot weather does not necessarily mean higher output. |
| Dust, dirt, and snow | Material covering a panel can block sunlight and lower its output. The effect depends on how much of the surface is covered. | Losses are site-specific and may be more noticeable in dusty areas or when snow remains on the panels. | Panel angle, rainfall, and safe maintenance practices affect how quickly surfaces clear. |
| System components and electrical losses | Inverters, wiring, connections, and energy storage can reduce the amount of electricity available for use compared with the panels’ direct-current output. | Actual system output is lower than the sum of panel ratings because of operating conditions and conversion losses. | Compare estimates on the same basis, such as panel output versus usable alternating-current electricity. |
Note: Figures are general reference values. Actual solar energy production depends on the site, system design, weather, and operating conditions.