Choosing the right solar energy solutions can reduce operating costs, improve resilience, and support measurable sustainability goals. Yet no single system suits every business. A warehouse may benefit from a large rooftop photovoltaic array, while a city office may need a smaller installation with battery storage. A retailer could pair solar panels with smart energy controls and electric vehicle charging. The best choice depends on roof condition, electricity demand, local tariffs, available space, and long-term plans.
Practical decisions should begin with evidence. Review at least twelve months of utility bills, inspect shading patterns, and confirm the roof’s structural capacity. Qualified installers can model production, estimate maintenance needs, and explain degradation rates, warranties, and expected payback. Businesses should also compare direct ownership, leasing, and power purchase agreements. Each option carries different financial and operational responsibilities. Battery systems can protect critical equipment during outages, but their costs may not justify their value everywhere. That is an important limitation.
Details matter.
A reliable assessment should include local permitting rules, interconnection requirements, insurance conditions, and equipment certifications. Independent financial review can also expose optimistic production forecasts or hidden replacement costs. This guide examines leading solar energy solutions through that practical lens. It considers performance, resilience, financing, scalability, and environmental value. Some recommendations may change as energy prices, technology, and regulations evolve. Businesses should treat projections as informed estimates, not promises. A careful decision leaves room for revision.
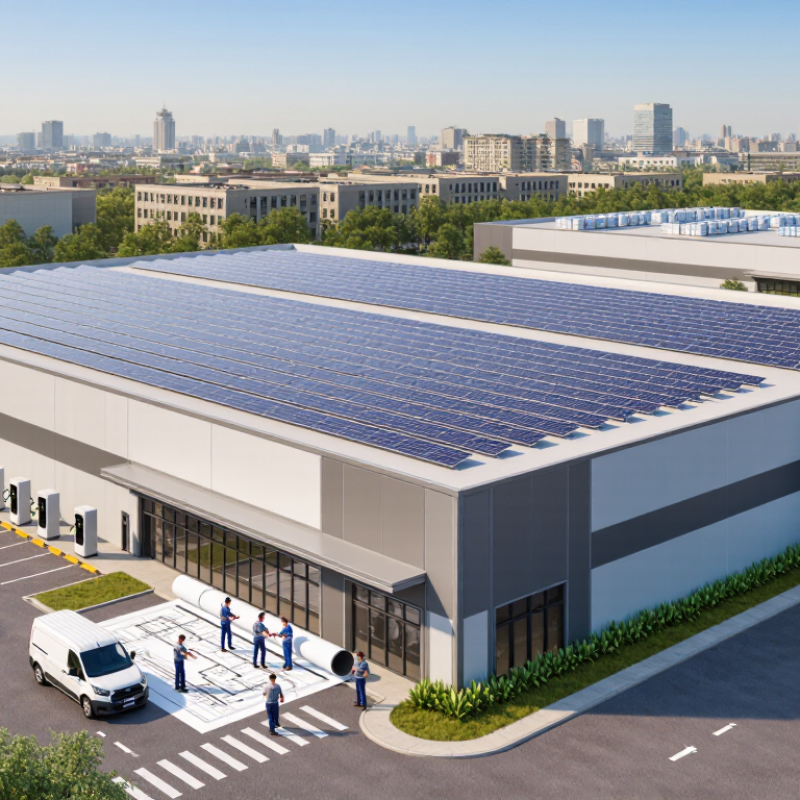
Businesses can choose from four main solar energy solutions: on-site photovoltaic systems, power purchase agreements, battery storage, and community solar. Each option fits a different operating pattern. On-site PV panels convert sunlight directly into electricity for offices, warehouses, or factories. A site assessment should examine roof age, structural capacity, shading, grid limits, and daytime demand. A 100-kilowatt system may perform well on a busy warehouse, but less effectively on an office that closes before sunset.
A power purchase agreement allows a business to use solar electricity without purchasing the equipment upfront. The provider usually installs and maintains the system, while the business pays for generated power under a long-term contract. Careful review matters. Check the energy price, annual adjustments, contract length, roof responsibilities, and early termination terms. The lowest starting rate may not remain the lowest cost. Read every clause.
Battery storage adds flexibility. It can store midday solar power for evening operations, reduce demand charges, and provide limited backup during outages. However, batteries require space, safety controls, monitoring, and eventual replacement planning. They are not always financially sensible. Community solar offers another path for businesses with shaded roofs, rented premises, or limited installation space. The company subscribes to a shared solar project and receives credits linked to its electricity use. Results depend on local rules, project availability, and credit structures. No option is flawless. A reliable decision compares twelve months of utility bills with realistic production estimates, not optimistic projections.

This comparison uses a practical 1–5 planning scale based on the defining characteristics of each solution: higher scores indicate greater upfront capital exposure, operational control, bill predictability, resilience, or on-site generation. Scores are directional rather than vendor-specific financial estimates.
Businesses assessing on-site solar PV should begin with the roof, not the panel catalogue. IRENA’s Renewable Capacity Statistics 2024 recorded 345.5 GW of global solar PV additions in 2023. That figure represents roughly three-quarters of new renewable capacity. It is a useful benchmark, but not a promise for one building.
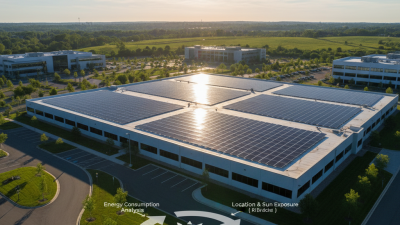
A practical rooftop assessment measures usable area, shade, roof age, slope, and structural capacity. A 10,000-square-metre roof rarely provides 10,000 square metres for modules. Vents, safety paths, drainage zones, and setbacks reduce the installation area. Engineers should also compare hourly electricity demand with expected solar production. A warehouse may have a large roof, yet consume little power at midday. An office may need more electricity during working hours.
Energy yield models should include local weather data, temperature losses, inverter losses, soiling, and future shading. The IEA Photovoltaic Power Systems Programme reported much higher global 2023 PV deployment than IRENA, partly because reporting methods differ. That gap deserves attention. It shows why decision-makers must define the measurement basis before comparing projects.
Site visits reveal problems that satellite images miss. I have seen apparently suitable roofs weakened by hidden moisture damage and crowded by maintenance equipment. Structural surveys, fire-access reviews, grid studies, and twelve months of utility bills create a more defensible business case. The output may be smaller than expected. It may also be safer, more accurate, and easier to finance.
What Are the Top Solar Energy Solutions for Businesses?
Corporate solar power purchase agreements are expanding quickly. BloombergNEF reported more than 46 GW of corporate PPAs signed globally in 2023. This figure signals stronger demand for predictable electricity costs and documented renewable energy use. It also shows a harder problem: companies must compare contracts, not just headline prices.
A fixed-price PPA offers clearer budgeting, while an indexed contract may follow market movements. Escalator clauses can increase payments each year. Contract length often ranges from ten to twenty-five years, creating both price certainty and commitment risk. Buyers should examine project location, expected generation, curtailment rules, imbalance costs, renewable certificates, and termination provisions. Read the settlement clause.
The International Energy Agency reports that renewable power capacity continues to expand rapidly, increasing the importance of grid access and project delivery. The National Renewable Energy Laboratory also highlights differences in PPA structure, including volume risk and contract flexibility. A low price may look attractive, but it can hide hourly mismatch or weak production guarantees. I would not treat any forecast as certain; weather, transmission limits, and permitting can change the result. A practical comparison should model monthly energy demand against expected solar output, then test low-generation years. That exercise is less exciting, but usually more useful. Companies should request transparent assumptions, independent production assessments, and clear evidence of project progress before signing.
The table compares common solar power-purchase structures and related business solutions. Commercial terms vary by jurisdiction, project size, credit profile, grid rules, and market conditions.
| Solar Solution / Contract Type | Asset Location | How the Business Receives Value | Typical Term | Capital Requirement | Main Advantages | Key Considerations | Best-Suited Business Profile |
|---|---|---|---|---|---|---|---|
| Onsite Physical Solar PPA | Solar system installed on or near the business premises | Solar electricity is delivered directly to the facility behind the meter | Usually 10–25 years | Usually low or none for the customer | Potentially lower electricity costs; reduced grid purchases; no upfront system ownership cost | Roof condition, available space, site control, production variability, and contract transfer terms | Businesses with suitable roofs, land, and stable daytime electricity demand |
| Offsite Physical Solar PPA | Utility-scale solar project connected to the electricity grid | Contracted power is scheduled and delivered through the grid, subject to market and network rules | Usually 10–20 years | Usually low or none for the customer | Supports larger electricity volumes and geographic flexibility; may provide long-term price visibility | Transmission constraints, balancing charges, delivery rules, project delays, and volume mismatch | Multi-site or high-load businesses unable to host enough onsite generation |
| Virtual Solar PPA | Usually an offsite solar project in a wholesale electricity market | A financial contract settles the difference between an agreed strike price and a market reference price; electricity is purchased separately | Usually 10–20 years | No construction capital, but financial credit support may be required | Accessible across broader locations; can support renewable claims and long-term price hedging | Basis risk, market-price volatility, settlement exposure, accounting treatment, and credit requirements | Large commercial or industrial buyers with energy-market expertise and strong credit quality |
| Sleeved Solar PPA | Offsite solar project, with an intermediary managing delivery and market interfaces | Renewable electricity is delivered through the grid under a structured supply arrangement | Usually 10–20 years | Usually low or none for the customer | Combines project contracting with managed electricity supply and settlement services | Additional service fees, contract complexity, supply-shaping costs, and intermediary credit exposure | Businesses seeking a physical supply arrangement without managing wholesale-market operations directly |
| Community Solar Subscription | Shared solar project serving multiple electricity customers | The customer receives bill credits or other benefits based on an allocated share of project output | Often 1–10 years, depending on local rules | Low or none | Useful where onsite solar is impractical; generally easier to adopt than a long-term PPA | Availability depends on local programs; savings, subscription terms, and bill-credit rules vary | Small and medium-sized businesses with limited roof space or short site tenure |
| Business-Owned Solar System | Onsite or nearby customer-controlled property | The business owns the generation asset and uses the electricity directly or exports excess power where permitted | Asset life commonly exceeds 20 years; modules often carry performance warranties of 25 years or more | High upfront capital or separate financing required | Maximum control over the asset, potential long-term savings, and direct ownership of environmental attributes where applicable | Maintenance, performance risk, permitting, financing, tax treatment, and asset ownership responsibilities | Businesses with available capital, long site tenure, and the ability to manage infrastructure investments |
| Solar Plus Battery Storage | Usually onsite, or paired with an offsite solar project | Stores solar generation for later use and may reduce peak demand or provide backup capability | Solar contracts commonly span 10–25 years; battery warranties are often shorter and technology-specific | Low under a service agreement; moderate to high if customer-owned | Improves solar self-consumption, supports demand management, and can increase resilience where designed for backup use | Battery degradation, fire-safety requirements, operating limits, replacement costs, and tariff eligibility | Facilities with high demand charges, evening loads, critical operations, or grid-reliability concerns |
Reference: BloombergNEF, 2023 corporate clean-energy PPA market data; contract durations and operating characteristics are industry-standard ranges and may vary by project and jurisdiction.
What Are the Top Solar Energy Solutions for Businesses?
Solar-plus-storage can turn a business rooftop into a controllable energy asset. NREL’s 2024 Annual Technology Baseline uses four-hour battery storage as a key comparison point for solar-plus-storage systems. This benchmark is useful, but it is not a universal prescription. A 500-kilowatt battery paired with 2 megawatt-hours of storage could cover a four-hour discharge window. However, actual performance depends on load patterns, solar production, and battery losses.
The International Energy Agency’s Renewables 2024 report identifies solar power as the largest source of new renewable capacity growth. That growth strengthens the case for pairing daytime generation with evening demand. Businesses should compare the battery’s power rating, energy capacity, and usable state-of-charge range. A cold-storage facility may need steady discharge overnight. An office building may need shorter bursts during afternoon peaks. The difference matters.
A four-hour design can still be wrong. That is the uncomfortable part. A detailed interval-load study should examine at least twelve months of electricity data, demand charges, outage risks, and local export rules. NREL’s benchmark supports transparent comparisons, yet it cannot replace site-specific engineering. Oversizing batteries increases capital costs and may leave capacity unused. Undersizing them can miss peak-saving opportunities. IEA analysis also shows that grid flexibility is becoming more valuable as variable renewable generation expands, but value changes by market and hour.
Businesses evaluating solar projects need more than a bright rooftop and a favorable forecast. A widely cited 2024 financial benchmark places utility-scale solar costs near $29–$92 per megawatt-hour. This range is useful, but it is not a promised electricity price. It reflects different financing assumptions, locations, equipment costs, and project conditions.
A practical review starts with twelve months of interval meter data. Compare daytime demand with expected solar production. A warehouse using power at noon may capture strong savings through onsite generation. An office with evening demand may need batteries or grid purchases. Storage can improve control, but it adds capital costs, replacement planning, and efficiency losses. Interconnection studies can also change the budget. They are often underestimated.
Project teams should test several cases instead of trusting one attractive estimate. Model interest rates, panel degradation, maintenance, insurance, curtailment, and changes in electricity tariffs. Check the roof’s age and structural capacity before requesting detailed bids. Small details matter. A shaded loading area can reduce output noticeably.
The $29–$92/MWh range offers a disciplined starting point for comparing solar with grid power, efficiency upgrades, and other generation options. Yet local economics decide the result. My own caution is simple: a clean spreadsheet can still hide weak assumptions. Conservative production estimates and independent technical review make the decision more credible.